


Software quality isn't just a nice-to-have—it's the secret sauce that separates the investment and regret. But how do you know if software quality is high? In this guide, we're going to dig deep into the nitty-gritty of code quality. We'll explore the multifaceted nature of software quality and delve into practical methodologies for assessing and improving it. From static code analysis to performance monitoring and beyond, we'll uncover the tools and techniques that enable us to gauge the health of codebase and identify areas for enhancement.
In the fast-paced world of software development, where deadlines loom large and demands are ever-changing, one aspect remains non-negotiable: quality assurance. It's the silent architect behind every successful application, ensuring reliability, scalability, and maintainability. However, ensuring software quality isn't a one-size-fits-all endeavor—it requires a nuanced understanding of what constitutes genuine, actionable metrics and a commitment to clear communication and buy-in from the entire team.
In the quest for high quality software, it's easy to fall into the trap of superficial measurements. Metrics like lines of code written or the number of commits may provide a semblance of progress, but they fail to capture the true essence of software quality. Genuine metrics offer a more nuanced understanding of software quality, allowing teams to identify areas for improvement and make informed decisions.
For example, consider test coverage—a metric that measures the percentage of codebase covered by automated tests. While superficial measurements may prioritize quantity over quality, focusing solely on increasing the number of tests, genuine metrics assess the effectiveness of these tests in ensuring code reliability and robustness.
Genuine metrics enable teams to track progress over time and set realistic goals for improvement. Instead of relying on arbitrary targets or benchmarks, teams can use actionable metrics to measure their performance against industry standards and best practices. This allows for continuous evaluation and refinement of software quality processes, ensuring that they remain relevant and effective in the ever-evolving landscape of software development.
But metrics alone are not enough. Clear communication and buy-in from the entire team are essential. After all, software quality is not the responsibility of a single individual—it's a collective effort that requires collaboration and alignment.
By fostering an environment of open communication and transparency, teams can ensure that everyone understands the importance of software quality measurement and is committed to the process. This means setting clear expectations, providing ongoing training and support, and celebrating successes together.
A witchhunt is not the way to go! People scared of being punished will be trying to hide their shortcomings instead of bringing them to light. When team members understand the rationale behind these processes and see the value they bring to the project, they are more likely to actively participate and contribute.
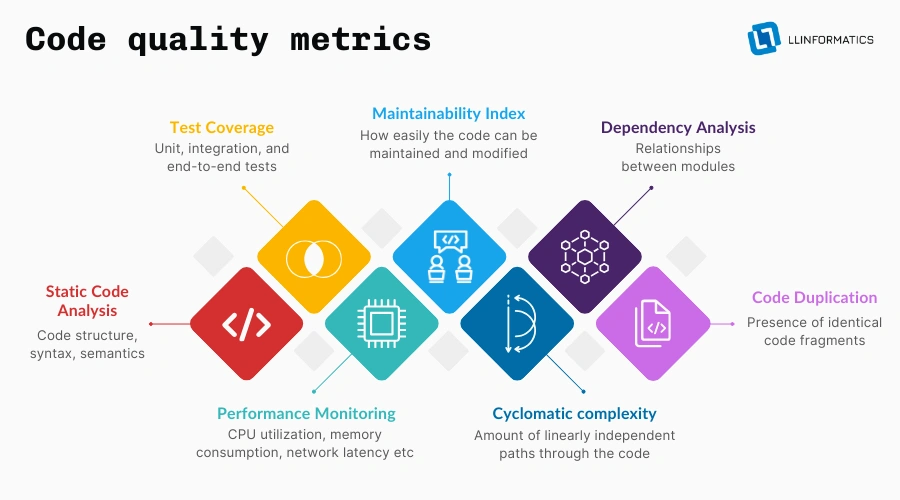
Static code analysis is a technique used to examine source code without executing it. Unlike dynamic analysis, which involves running the code and observing its behavior, static analysis analyzes the code structure, syntax, and semantics to identify potential issues. This process can uncover a wide range of problems, including syntax errors, coding conventions violations, and potential security vulnerabilities. But static code analysis isn't just about flagging issues—it's about providing tangible insights that drive meaningful change.
Static code analysis is typically integrated into the software development process as an automated step. It can be performed during code compilation, continuous integration, or as a standalone process. By analyzing the code at an early stage, developers can catch issues before they escalate, saving time and resources in the long run.
Several tools are available for performing static code analysis, each with its own set of features and capabilities. Tools like SonarQube, CodeClimate, and ESLint assess code against coding standards and best practices, providing developers with valuable feedback on software quality. These tools examine factors such as code complexity, adherence to coding conventions, and potential security vulnerabilities empowering developers to write cleaner, more maintainable code.
Test coverage is a metric used to measure the percentage of codebase covered by automated tests. It provides insight into how thoroughly the code has been tested and helps identify areas that may require additional testing. Test coverage can be measured at various levels, including unit tests, integration tests, and end-to-end tests. Here are some common measures:
By using these measures in combination, teams can gain a comprehensive understanding of test coverage and identify areas for improvement in their testing efforts.
The primary purpose of measuring test coverage is to ensure that critical components of the codebase are rigorously tested. By assessing the percentage of code covered by tests, teams can gain confidence in the reliability and robustness of their software. Test coverage also helps identify areas of the code that may be more prone to defects, allowing teams to prioritize testing efforts accordingly.
Test coverage is typically integrated into the software development process as part of the testing phase. It involves writing and executing automated tests to validate the functionality and behavior of the code. Test coverage can be measured continuously throughout the development cycle, allowing teams to track progress and identify gaps in test coverage early on.
While achieving 100% test coverage may seem like the ultimate goal, in practice, it's often not feasible or practical. There are several reasons why:
It's essential to strike a balance between achieving high coverage and practical considerations such as prioritization, efficiency, and effectiveness. Rather than striving for 100% coverage as an arbitrary goal, teams should focus on ensuring adequate coverage for critical components and prioritizing testing efforts where they will have the greatest impact on software quality and reliability.
Performance monitoring is the process of tracking and analyzing the performance of a software application in real time or over time. It isn't just about tracking response times or server loads—it's a nuanced exploration of every aspect of application behavior. From CPU utilization and memory consumption to network latency and database queries, performance monitoring delves into the intricacies of system performance to uncover hidden bottlenecks and inefficiencies.
Performance monitoring is integrated into the software development process as part of the testing and optimization phases. It allows teams to assess the performance impact of code changes, identify performance regressions, and optimize the application for better scalability and reliability.
To navigate this complex landscape, teams rely on a suite of advanced tools that offer unparalleled insights into application performance. Tools like Grafana, Prometheus, and InfluxDB provide real-time visualization of performance metrics, allowing teams to drill down into specific components and identify performance hotspots with pinpoint accuracy.
Poor performance isn't just a symptom of inefficient algorithms or bloated code—it's often indicative of deeper underlying issues such as suboptimal database queries, inefficient resource utilization, or architectural flaws that require expert-level analysis to uncover and address. By correlating performance metrics with code changes and quality metrics, teams can pinpoint the root cause of performance issues and take corrective action to improve software quality and optimize application performance.
The Maintainability Index is a composite metric that assesses the ease with which code can be maintained or modified over time. It comprises several key components, each offering unique insights into different aspects of software quality:
Teams rely on advanced tools that offer comprehensive insights into software quality metrics to assess and improve maintainability. Tools like Visual Studio's Code Metrics feature and SonarQube's Maintainability Index Calculator provide developers with actionable feedback on maintainability issues and technical debt. These tools analyze code against a set of predefined criteria, highlighting areas where improvements can be made to enhance maintainability and reduce technical debt.
Maintainability isn't just a buzzword—it's a critical factor that directly impacts the long-term viability, sustainability and cost efficiency of software project. Software project that is difficult to maintain or modify over time can lead to increased maintenance costs, longer time-to-market, and decreased agility in responding to changing requirements. By enhancing maintainability and reducing technical debt, teams can streamline development processes, ensure high-quality software, and ensure the continued success of their software engineering.
Cyclomatic Complexity is a software metric that quantifies the complexity of a program by measuring the number of linearly independent paths through the code. In simpler terms, it provides a numerical representation of the structural complexity of a piece of code. The higher the cyclomatic complexity, the more intricate and convoluted the code structure.
Cyclomatic complexity is more than just a number—it's a powerful indicator of software quality and maintainability. By quantifying the complexity of code, it offers insights into potential areas of risk, such as spaghetti code, tight coupling, and high cognitive load for developers.
Understanding Cyclomatic Complexity allows teams to identify and mitigate complexity hotspots, leading to more maintainable, scalable, and reliable software.
Cyclomatic complexity is calculated based on the number of decision points in the code, such as loops, conditionals, and branching statements. Each decision point adds to the overall complexity of the code, as it introduces additional paths that must be considered during the software development life cycle.
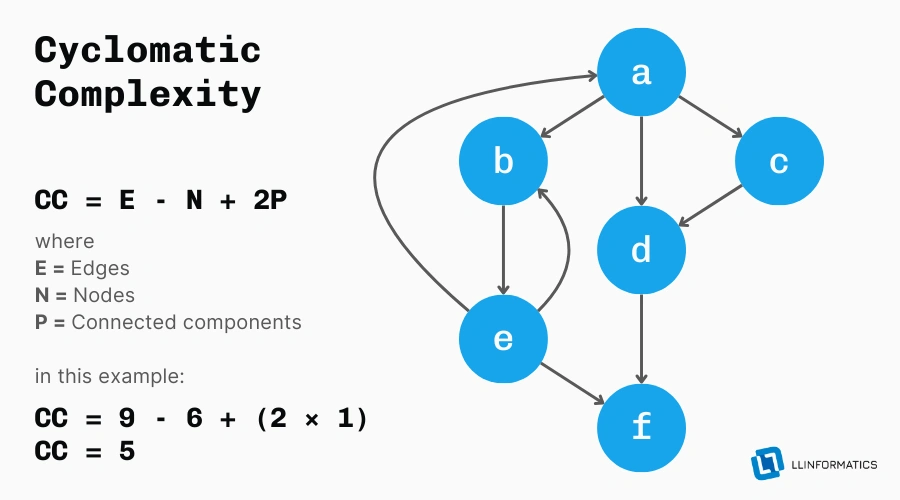
The formula for calculating cyclomatic complexity is typically based on the number of edges, nodes, and connected components in the control flow graph of the code.
A commonly used formula is CC = E - N + 2P, where:
E = number of edgesN = number of nodesP = number of connected componentsHigh cyclomatic complexity can have a profound impact on code maintainability. As complexity increases, so does the cognitive load on developers, making it harder to understand, debug, and modify the code.
Complex code is also more error-prone and difficult to test, leading to increased maintenance costs and decreased overall software quality. By reducing Cyclomatic Complexity, teams can improve code maintainability, enhance developer productivity, and mitigate the risk of defects.
Dependency analysis is the process of assessing the relationships and connections between modules or components within a software system. It involves identifying dependencies, both direct and transitive, and analyzing their impact on the overall structure and behavior of the system. Dependency Analysis provides insights into how changes to one module can affect other modules, helping software teams understand and manage the complexity of their codebase.
Dependency Analysis is more than just a theoretical exercise—it's a critical aspect of software quality measurement. By understanding the dependencies between modules, teams can identify potential areas of risk, such as tight coupling, circular dependencies, and spaghetti code. Dependency Analysis is essential for understanding the architecture and structure of a software system. It allows teams to identify potential points of failure, bottlenecks, and performance issues, enabling them to prioritize areas for improvement and optimization. By assessing dependencies, teams can also identify opportunities for code refactoring, abstraction, and decoupling, leading to a more flexible, maintainable, and extensible codebase.
Dependency Analysis can be measured using various metrics and techniques. Tools like Dependency Structure Matrix (DSM) and Dependency Graphs provide visualizations of module dependencies, allowing teams to identify patterns and dependencies that may need to be addressed. Metrics such as coupling intensity, instability, and package cohesion offer insights into the quality of dependencies and their impact on code maintainability.
Excessive dependencies and coupling can pose significant risks to software quality and maintainability. Tight coupling between modules increases the risk of cascading changes, where modifications to one module require changes to multiple other modules. This leads to increased complexity, longer software development life cycle, and higher maintenance costs. Excessive dependencies can also hinder code reuse, scalability, and testability, making it harder to evolve and adapt the software over time.
Code duplication, also known as code redundancy or copy-paste programming, refers to the presence of identical or nearly identical code fragments in different parts of a codebase. It is a common phenomenon in software development and can occur at various levels, including within functions, across modules, or even between different projects. Code Duplication is more than just a cosmetic issue—it has significant implications for software quality, maintainability, and scalability.
It is more than just an inconvenience—it's a pervasive issue that can have far-reaching consequences for software product. It increases maintenance overhead, as changes made to one copy of duplicated code must be replicated across all other instances, leading to inconsistency, errors, and inefficiency. Code Duplication also undermines code readability, as software developers are forced to navigate through redundant code fragments, making it harder to understand and maintain.
Measuring code duplication involves identifying duplicate code fragments within a codebase and quantifying their extent and impact. Tools like PMD, SonarQube, and CodeClimate offer automated code duplication detection capabilities, allowing teams to identify duplicate code and assess its impact on software product. Metrics such as duplication percentage, duplication density, and duplication coverage provide insights into the prevalence and severity of code duplication within a codebase.
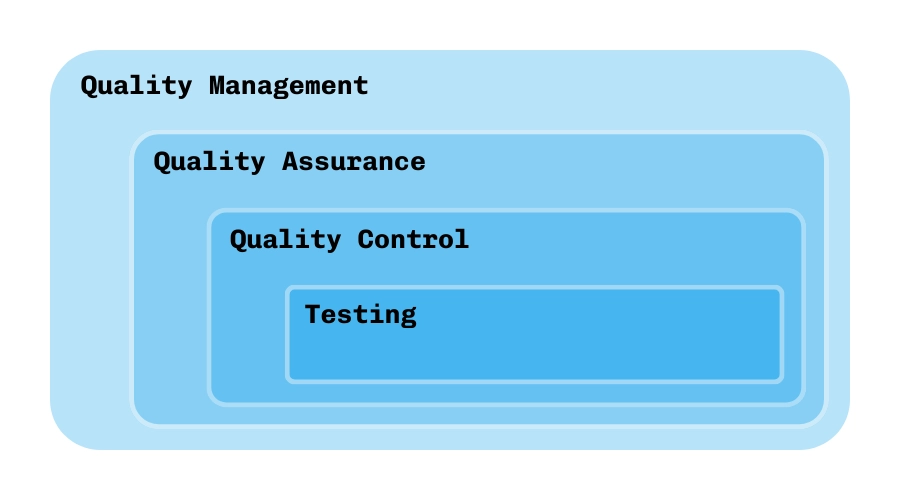
Implementing effective quality assurance is the hallmark of successful software development. However, the path to this achievement is not without its challenges.
Implementing quality control practices can be fraught with challenges, ranging from organizational resistance to technical constraints. Some common challenges include:
There are several strategies that will help to achieve quality in software development despite the challenges. Here's the list of the most popular practices to convince software engineers that they should ensure software quality:
By prioritizing ongoing monitoring and adjustments, organizations can ensure that key performance indicators remain relevant and effective in driving continuous improvement and delivering high-quality software products.